Gobal Warming - what does it mean for our generation

  • Christian Chat is a moderated online Christian community allowing Christians around the world to fellowship with each other in real time chat via webcam, voice, and text, with the Christian Chat app. You can also start or participate in a Bible-based discussion here in the Christian Chat Forums, where members can also share with each other their own videos, pictures, or favorite Christian music.

    If you are a Christian and need encouragement and fellowship, we're here for you! If you are not a Christian but interested in knowing more about Jesus our Lord, you're also welcome! Want to know what the Bible says, and how you can apply it to your life? Join us!

    To make new Christian friends now around the world, click here to join Christian Chat.

Omni

Banned
Aug 12, 2015
539
7
0
#21
So one wants us to prove our points using data researched by experts and the other wants us to not use experts...lol

I think I will use what I like to make the points I like.... this is a hoax and all honest people who have done any research know it is.
You're either unwilling to try to understand the science, or you're just not smart enough to get it. The second is nobody's fault, but the first is gratuitous and dangerous.
 
M

Mitspa

Guest
#22
You're either unwilling to try to understand the science, or you're just not smart enough to get it. The second is nobody's fault, but the first is gratuitous and dangerous.
seems like more and more educated folks in this field are becoming as dumb as I am....wonder why?
 

PennEd

Senior Member
Apr 22, 2013
13,111
8,765
113
#23
I challenge anybody who denies climate change to make statements from their own wording, with clear underpinning scientific understanding, to show that climate change is false. My suspicion is that the people here who are denying it are doing so because they have a sociopolitical or religious viewpoint that they believe (due to false media propagation) is incompatible with believing in climate change. This is silly, for a lot of reasons, but primarily because sociopolitical or religious beliefs are subjective; scientific facts are not.

PennEd asserts that climate change is false, yet provides no illustration that he understands the scientific principles necessary for such an argument to be made logically, while Mitspa implies that climate change is false on the presumption that scientists have "changed the name". That's also silly, for a number of reasons.

Global warming is what it sounds like -- it is an overall global trend towards an increase in thermal energy; a rise in average global temperature. And climate change is also what it sounds like -- changes in global climate (not to be confused with weather).

Mitspa's misconception lies in the assumption that global warming and climate change are mutually exclusive. They aren't. Global warming is driving a very specific climactic change. And of course, I can hear the rebuttal "but climate always changes". Yes, it does. It's true that the Earth has undergone several climactic shifts in its history, an argument I've heard several times before from climate-change-deniers (which, frankly, is a bit absurd since the same people obviously recognize that climactic shifts happened in the past, and as all of us evolutionists know, as per Ken Hom and the YEC Climate Deniers, "you can't prove what happened in the past", but anyway). These climactic shifts have happened with specific trends in the past. They come about gradually, and naturally. The issue with modern climactic changes is that they aren't following past trends. The Earth is warming alarmingly quickly, and since we know the CO2, methane, and other gases cause a heat-trapping effect, and since we can observe that the levels of these gases has dramatically increased (perfectly proportionally to the dramatic increase in heat, in fact), we can deduce that human production of these gases is driving climactic change at an unusual pace.

Why is this a problem?

Well, it's a problem for several reasons. If we allow the Earth to keep warming this dramatically, to keep exponentially getting warmer, our planet is going to suffer for it. If the planet suffers, then so do we. Hint: We are part of this planet. We depend on this planet for everything. We depend on it for our food, our water, our land, our shelter, our heat. Everything.

There are 50 years of oil left, and a hundred years of gas. If we burn it all (as it seems many people are intent on doing) we will cause the ice caps to melt thousands of years more quickly than they would have, had we not industrialized ourselves so hastily with the advent of fossil fuels. This means a sea level rise that will wipe out most of the American Eastern Seaboard. It means the virtual destruction of Pakistan and Bangladesh. It means the total submerging of London. It means fiercer storms, harsher weather, melted icecaps. It means mass human extinction.

It's not about making energy more expensive, it's about finding alternatives to fossil fuels and making them affordable for everybody. In order to do that, we need energy companies to invest heavily in those alternatives. They do exist, but the biggest obstacle to realizing a world without fossil fuels is a simple obstacle; human greed -- the pursuit of profit.

We are putting massive profits for the few, above a safe and healthy planet for the many.
You aasked for it. Here ya go:

[h=1]The fiddling with temperature data is the biggest science scandal ever[/h][h=2]New data shows that the “vanishing” of polar ice is not the result of runaway global warming[/h][TABLE]
[TR]
[TD][TABLE]
[TR]
[TD="class: gig-button-td"][TABLE]
[TR]
[TD][/TD]
[TD="align: left"]
[/TD]
[TD]Facebook
[/TD]
[TD][/TD]
[/TR]
[/TABLE]

[/TD]
[TD]
99K​
[/TD]
[/TR]
[/TABLE]

[/TD]
[TD][TABLE]
[TR]
[TD="class: gig-button-td"][TABLE]
[TR]
[TD][/TD]
[TD="align: left"]
[/TD]
[TD]Twitter
[/TD]
[TD][/TD]
[/TR]
[/TABLE]

[/TD]
[TD]
14K​
[/TD]
[/TR]
[/TABLE]

[/TD]
[TD][TABLE]
[TR]
[TD="class: gig-button-td"][TABLE]
[TR]
[TD][/TD]
[TD="align: left"]
[/TD]
[TD]Pinterest
[/TD]
[TD][/TD]
[/TR]
[/TABLE]

[/TD]
[TD]
390​
[/TD]
[/TR]
[/TABLE]

[/TD]
[TD][TABLE]
[TR]
[TD="class: gig-button-td"][TABLE]
[TR]
[TD][/TD]
[TD="align: left"]
[/TD]
[TD]LinkedIn
[/TD]
[TD][/TD]
[/TR]
[/TABLE]

[/TD]
[TD]
657​
[/TD]
[/TR]
[/TABLE]

[/TD]
[TD][TABLE]
[TR]
[TD="class: gig-button-td"][TABLE]
[TR]
[TD][/TD]
[TD="align: left"]
[/TD]
[TD]Share
[/TD]
[TD][/TD]
[/TR]
[/TABLE]

[/TD]
[TD]
114K​
[/TD]
[/TR]
[/TABLE]

[/TD]
[TD][TABLE]
[TR]
[TD][/TD]
[TD="align: left"]
[/TD]
[TD]Email
[/TD]
[TD][/TD]
[/TR]
[/TABLE]


[/TD]
[/TR]
[/TABLE]


The “vanishing” of polar ice (and the polar bears) has become a poster-child for warmists. Photo: ALAMY


By Christopher Booker

10:15PM GMT 07 Feb 2015
31421 Comments


When future generations look back on the global-warming scare of the past 30 years, nothing will shock them more than the extent to which the official temperature records – on which the entire panic ultimately rested – were systematically “adjusted” to show the Earth as having warmed much more than the actual data justified.

Two weeks ago, under the headline “How we are being tricked by flawed data on global warming”, I wrote about Paul Homewood, who, on his Notalotofpeopleknowthat blog, had checked the published temperature graphs for three weather stations in Paraguay against the temperatures that had originally been recorded. In each instance, the actual trend of 60 years of data had been dramatically reversed, so that a cooling trend was changed to one that showed a marked warming.

This was only the latest of many examples of a practice long recognised by expert observers around the world – one that raises an ever larger question mark over the entire official surface-temperature record.


[SUP]Watch: Climate change explained in 60 second animation[/SUP]
Following my last article, Homewood checked a swathe of other South American weather stations around the original three. In each case he found the same suspicious one-way “adjustments”. First these were made by the US government’s Global Historical Climate Network (GHCN). They were then amplified by two of the main official surface records, the Goddard Institute for Space Studies (Giss) and the National Climate Data Center (NCDC), which use the warming trends to estimate temperatures across the vast regions of the Earth where no measurements are taken. Yet these are the very records on which scientists and politicians rely for their belief in “global warming”.

[h=2]Related Articles[/h]


Homewood has now turned his attention to the weather stations across much of the Arctic, between Canada (51 degrees W) and the heart of Siberia (87 degrees E). Again, in nearly every case, the same one-way adjustments have been made, to show warming up to 1 degree C or more higher than was indicated by the data that was actually recorded. This has surprised no one more than Traust Jonsson, who was long in charge of climate research for the Iceland met office (and with whom Homewood has been in touch). Jonsson was amazed to see how the new version completely “disappears” Iceland’s “sea ice years” around 1970, when a period of extreme cooling almost devastated his country’s economy.
One of the first examples of these “adjustments” was exposed in 2007 by the statistician Steve McIntyre, when he discovered a paper published in 1987 by James Hansen, the scientist (later turned fanatical climate activist) who for many years ran Giss. Hansen’s original graph showed temperatures in the Arctic as having been much higher around 1940 than at any time since. But as Homewood reveals in his blog post, “Temperature adjustments transform Arctic history”, Giss has turned this upside down. Arctic temperatures from that time have been lowered so much that that they are now dwarfed by those of the past 20 years.

Homewood’s interest in the Arctic is partly because the “vanishing” of its polar ice (and the polar bears) has become such a poster-child for those trying to persuade us that we are threatened by runaway warming. But he chose that particular stretch of the Arctic because it is where ice is affected by warmer water brought in by cyclical shifts in a major Atlantic current – this last peaked at just the time 75 years ago when Arctic ice retreated even further than it has done recently. The ice-melt is not caused by rising global temperatures at all.
Of much more serious significance, however, is the way this wholesale manipulation of the official temperature record – for reasons GHCN and Giss have never plausibly explained – has become the real elephant in the room of the greatest and most costly scare the world has known. This really does begin to look like one of the greatest scientific scandals of all time.
For more stories, like the Telegraph's Facebook page by clicking on the link below:


[h=3][/h][h=3][/h][h=3][/h][h=3][/h][h=3][/h]


[TABLE]
[TR]
[TD][TABLE]
[TR]
[TD="class: gig-button-td"][TABLE]
[TR]
[TD][/TD]
[TD="align: left"]
[/TD]
[TD]Facebook
[/TD]
[TD][/TD]
[/TR]
[/TABLE]

[/TD]
[TD]
99K​
[/TD]
[/TR]
[/TABLE]

[/TD]
[TD][TABLE]
[TR]
[TD="class: gig-button-td"][TABLE]
[TR]
[TD][/TD]
[TD="align: left"]
[/TD]
[TD]Twitter
[/TD]
[TD][/TD]
[/TR]
[/TABLE]

[/TD]
[TD]
14K​
[/TD]
[/TR]
[/TABLE]

[/TD]
[TD][TABLE]
[TR]
[TD="class: gig-button-td"][TABLE]
[TR]
[TD][/TD]
[TD="align: left"]
[/TD]
[TD]Pinterest
[/TD]
[TD][/TD]
[/TR]
[/TABLE]

[/TD]
[TD]
390​
[/TD]
[/TR]
[/TABLE]

[/TD]
[TD][TABLE]
[TR]
[TD="class: gig-button-td"][TABLE]
[TR]
[TD][/TD]
[TD="align: left"]
[/TD]
[TD]LinkedIn
[/TD]
[TD][/TD]
[/TR]
[/TABLE]

[/TD]
[TD]
657​
[/TD]
[/TR]
[/TABLE]

[/TD]
[TD][TABLE]
[TR]
[TD="class: gig-button-td"][TABLE]
[TR]
[TD][/TD]
[TD="align: left"]
[/TD]
[TD]Share
[/TD]
[TD][/TD]
[/TR]
[/TABLE]

[/TD]
[TD]
114K​
[/TD]
[/TR]
[/TABLE]

[/TD]
[TD][TABLE]
[TR]
[TD][/TD]
[TD="align: left"]
[/TD]
[TD]Email
[/TD]
[TD][/TD]
[/TR]
[/TABLE]


[/TD]
[/TR]
[/TABLE]


More from The Telegraph
 
M

Mitspa

Guest
#24
Its all a left-wing hoax :( sorry guys...buy a new coat
 
M

Mitspa

Guest
#26
Its all a big lie and I hope that left leaning folks would put away their bias and acknowledge the facts...but that don't seem possible for some who believe whatever Obama, gore and Hillary tell them to believe?
 

Omni

Banned
Aug 12, 2015
539
7
0
#27
Scientists have never hidden the fact that temperature data is adjusted, but obviously you don't, can't, or won't, understand why it is.

[TABLE]
[TR]
[TD]Quality Control

Once the data has been collected, it is subjected to an automated quality control (QC) procedure that looks for anomalies like repeated entries of the same temperature value, minimum temperature values that exceed the reported maximum temperature of that day (or vice-versa), values that far exceed (by five sigma or more) expected values for the station, and similar checks. A full list of QC checks is available here.Daily minimum or maximum temperatures that fail quality control are flagged, and a raw daily file is maintained that includes original values with their associated QC flags. Monthly minimum, maximum, and mean temperatures are calculated using daily temperature data that passes QC checks. A monthly mean is calculated only when nine or fewer daily values are missing or flagged. A raw USHCN monthly data file is available that includes both monthly values and associated QC flags.The impact of QC adjustments is relatively minor. Apart from a slight cooling of temperatures prior to 1910, the trend is unchanged by QC adjustments for the remainder of the record (e.g. the red line in Figure 5).Time of Observation (TOBs) Adjustments

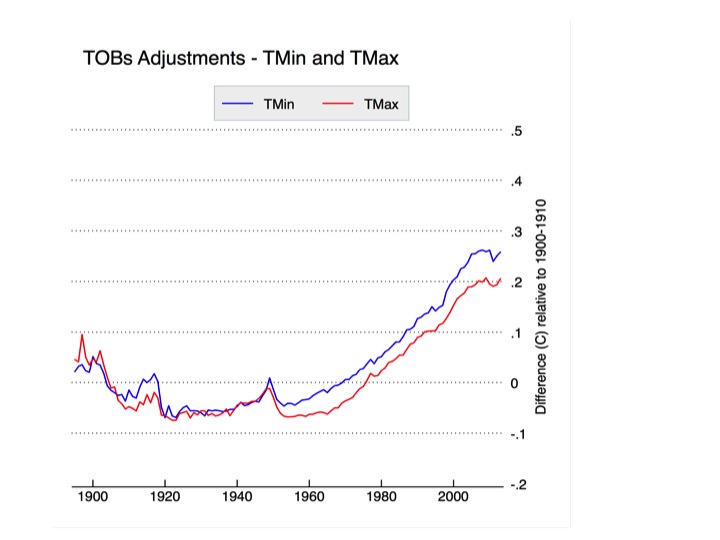
Temperature data is adjusted based on its reported time of observation. Each observer is supposed to report the time at which observations were taken. While some variance of this is expected, as observers won’t reset the instrument at the same time every day, these departures should be mostly random and won’t necessarily introduce systemic bias. The major sources of bias are introduced by system-wide decisions to change observing times, as shown in Figure 3. The gradual network-wide switch from afternoon to morning observation times after 1950 has introduced a CONUS-wide cooling bias of about 0.2 to 0.25 C. The TOBs adjustments are outlined and tested in Karl et al 1986 and Vose et al 2003, and will be explored in more detail in the subsequent post. The impact of TOBs adjustments is shown in Figure 6, below.
Figure 6. Time of observation adjustments to USHCN relative to the 1900-1910 period.TOBs adjustments affect minimum and maximum temperatures similarly, and are responsible for slightly more than half the magnitude of total adjustments to USHCN data.Pairwise Homogenization Algorithm (PHA) Adjustments

The Pairwise Homogenization Algorithm was designed as an automated method of detecting and correcting localized temperature biases due to station moves, instrument changes, microsite changes, and meso-scale changes like urban heat islands.The algorithm (whose code can be 
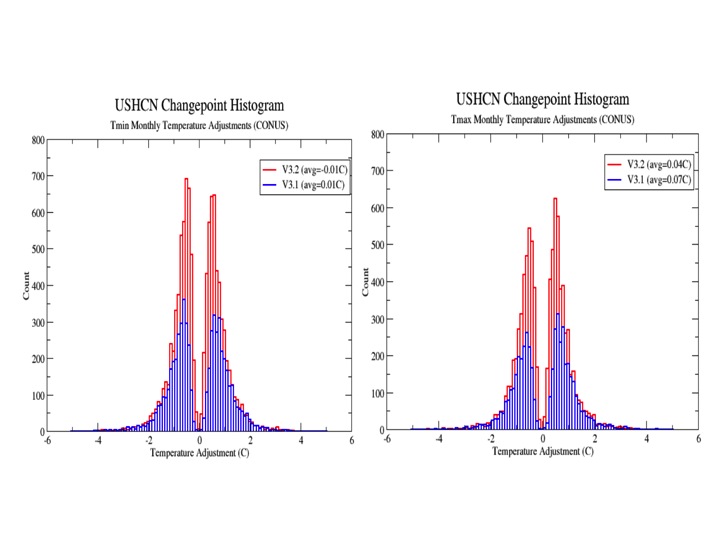
downloaded here) is conceptually simple: it assumes that climate change forced by external factors tends to happen regionally rather than locally. If one station is warming rapidly over a period of a decade a few kilometers from a number of stations that are cooling over the same period, the warming station is likely responding to localized effects (instrument changes, station moves, microsite changes, etc.) rather than a real climate signal.To detect localized biases, the PHA iteratively goes through all the stations in the network and compares each of them to their surrounding neighbors. It calculates difference series between each station and their neighbors (separately for min and max) and looks for breakpoints that show up in the record of one station but none of the surrounding stations. These breakpoints can take the form of both abrupt step-changes and gradual trend-inhomogenities that move a station’s record further away from its neighbors. The figures below show histograms of all the detected breakpoints (and their magnitudes) for both minimum and maximum temperatures.
Figure 7. Histogram of all PHA changepoint adjustments for versions 3.1 and 3.2 of the PHA for minimum (left) and maximum (right) temperatures.While fairly symmetric in aggregate, there are distinct temporal patterns in the PHA adjustments. The single largest of these are positive adjustments in maximum temperatures to account for transitions from LiG instruments to MMTS and ASOSinstruments in the 1980s, 1990s, and 2000s. Other notable PHA-detected adjustments are minimum (and more modest maximum) temperature shifts associated with a widespread move of stations from inner city rooftops to newly-constructed airports or wastewater treatment plants after 1940, as well as gradual corrections of urbanizing sites like Reno, Nevada. The net effect of PHA adjustments is shown in Figure 8, below.
Figure 8. Pairwise Homogenization Algorithm adjustments to USHCN relative to the 1900-1910 period.The PHA has a large impact on max temperatures post-1980, corresponding to the period of transition to MMTS and ASOS instruments. Max adjustments are fairly modest pre-1980s, and are presumably responding mostly to the effects of station moves. Minimum temperature adjustments are more mixed, with no real century-scale trend impact. These minimum temperature adjustments do seem to remove much of the urban-correlated warming bias in minimum temperatures, even if only rural stations are used in the homogenization process to avoid any incidental aliasing in of urban warming, as discussed in Hausfather et al. 2013.The PHA can also effectively detect and deal with breakpoints associated with Time of Observation changes. When NCDC’s PHA is run without doing the explicit TOBs adjustment described previously, the results are largely the same (see the discussion of this in Williams et al 2012). Berkeley uses a somewhat analogous relative difference approach to homogenization that also picks up and removes TOBs biases without the need for an explicit adjustment.With any automated homogenization approach, it is critically important that the algorithm be tested with synthetic data with various types of biases introduced (step changes, trendinhomogenities, sawtooth patterns, etc.), to ensure that the algorithm will identically deal with biases in both directions and not create any new systemic biases when correcting inhomogenities in the record. This was done initially in Williams et al 2012 and Venema et al 2012. There are ongoing efforts to create a standardized set of tests that various groups around the world can submit homogenization algorithms to be evaluated by, as discussed in our recently submitted paper. This process, and other detailed discussion of automated homogenization, will be discussed in more detail in part three of this series of posts.Infilling

Finally we come to infilling, which has garnered quite a bit of attention of late due to some rather outlandish claims of its impact. Infilling occurs in the USHCN network in two different cases: when the raw data is not available for a station, and when the PHA flags the raw data as too uncertain to homogenize (e.g. in between two station moves when there is not a long enough record to determine with certainty the impact that the initial move had). Infilled data is marked with an “E” flag in the adjusted data file (
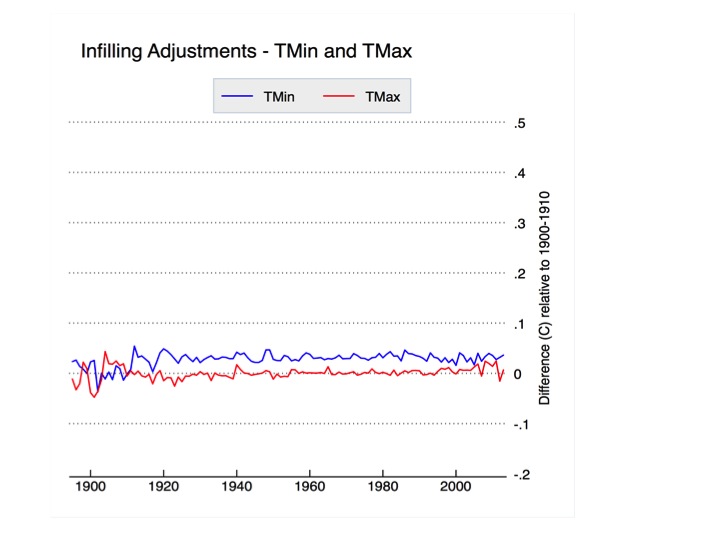
FLs.52i) provided byNCDC, and its relatively straightforward to test the effects it has by calculating U.S. temperatures with and without the infilled data. The results are shown in Figure 9, below:
Figure 9. Infilling-related adjustments to USHCN relative to the 1900-1910 period.Apart from a slight adjustment prior to 1915, infilling has no effect on CONUS-wide trends. These results are identical to those found in Menne et al 2009. This is expected, because the way NCDC does infilling is to add the long-term climatology of the station that is missing (or not used) to the average spatially weighted anomaly of nearby stations. This is effectively identical to any other form of spatial weighting.To elaborate, temperature stations measure temperatures at specific locations. If we are trying to estimate the average temperature over a wide area like the U.S. or the Globe, it is advisable to use gridding or some more complicated form of spatial interpolation to assure that our results are representative of the underlying temperature field. For example, about a third of the available global temperature stations are in U.S. If we calculated global temperatures without spatial weighting, we’d be treating the U.S. as 33% of the world’s land area rather than ~5%, and end up with a rather biased estimate of global temperatures. The easiest way to do spatial weighting is using gridding, e.g. to assign all stations to grid cells that have the same size (as NASA GISS used to do) or same lat/lon size (e.g. 5×5 lat/lon, as HadCRUT does). Other methods include kriging (used by Berkeley Earth) or a distance-weighted average of nearby station anomalies (used byGISS and NCDC these days).As shown above, infilling has no real impact on temperature trends vs. not infilling. The only way you get in trouble is if the composition of the network is changing over time and if you do not remove the underlying climatology/seasonal cycle through the use of anomalies or similar methods. In that case, infilling will give you a correct answer, but not infilling will result in a biased estimate since the underlying climatology of the stations is changing. Thishas been discussed at length elsewhere, so I won’t dwell on it here.I’m actually not a big fan of NCDC’s choice to do infilling, not because it makes a difference in the results, but rather because it confuses things more than it helps (witness all the sturm und drang of late over “zombie stations”). Their choice to infill was primarily driven by a desire to let people calculate a consistent record of absolute temperatures by ensuring that the station composition remained constant over time. A better (and more accurate) approach would be to create a separate absolute temperature product by adding a long-term average climatology field to an anomaly field, similar to the approach that Berkeley Earth takes.Changing the Past?

Diligent observers of NCDC’s temperature record have noted that many of the values change by small amounts on a daily basis. This includes not only recent temperatures but those in the distant past as well, and has created some confusion about why, exactly, the recorded temperatures in 1917 should change day-to-day. The explanation is relatively straightforward. NCDC assumes that the current set of instruments recording temperature is accurate, so any time of observation changes or PHA-adjustments are done relative to current temperatures. Because breakpoints are detected through pair-wise comparisons, new data coming in may slightly change the magnitude of recent adjustments by providing a more comprehensive difference series between neighboring stations.When breakpoints are removed, the entire record prior to the breakpoint is adjusted up or down depending on the size and direction of the breakpoint. This means that slight modifications of recent breakpoints will impact all past temperatures at the station in question though a constant offset. The alternative to this would be to assume that the original data is accurate, and adjusted any new data relative to the old data (e.g. adjust everything in front of breakpoints rather than behind them). From the perspective of calculating trends over time, these two approaches are identical, and its not clear that there is necessarily a preferred option.Hopefully this (and the following two articles) should help folks gain a better understanding of the issues in the surface temperature network and the steps scientists have taken to try to address them. These approaches are likely far from perfect, and it is certainly possible that the underlying algorithms could be improved to provide more accurate results. Hopefully the ongoing International Surface Temperature Initiative, which seeks to have different groups around the world send their adjustment approaches in for evaluation using common metrics, will help improve the general practice in the field going forward. There is also a week-long conference at NCAR next week on these issues which should yield some interesting discussions and initiatives.
_______________________________________________________________________

[/TD]
[/TR]
[/TABLE]
 
M

Mitspa

Guest
#28
All that to explain they lied about it....you got to give these liberals credit, when they get caught in a lie they really do the work to cover it up :)
 

PennEd

Senior Member
Apr 22, 2013
13,111
8,765
113
#29
THIS is why the powers that be need to control the media ala 1984. Here is the hoax exposed for what it is. Why would anyone choose to believe these people?


[h=1]FLASHBACK: ABC's ’08 Prediction: NYC Under Water from Climate Change By June 2015[/h]By Scott Whitlock | June 12, 2015 | 7:30 AM EDT
Share it Tweet it More Sharing Services


68940
shares


New York City underwater? Gas over $9 a gallon? A carton of milk costs almost $13? Welcome to June 12, 2015. Or at least that was the wildly-inaccurate version of 2015 predicted by ABC News exactly seven years ago. Appearing on Good Morning America in 2008, Bob Woodruff hyped Earth 2100, a special that pushed apocalyptic predictions of the then-futuristic 2015.
The segment included supposedly prophetic videos, such as a teenager declaring, "It's June 8th, 2015. One carton of milk is $12.99." (On the actual June 8, 2015, a gallon of milk cost, on average, $3.39.) Another clip featured this prediction for the current year: "Gas reached over $9 a gallon." (In reality, gas costs an average of $2.75.)

On June 12, 2008, correspondent Bob Woodruff revealed that the program "puts participants in the future and asks them to report back about what it is like to live in this future world. The first stop is the year 2015."
As one expert warns that in 2015 the sea level will rise quickly, a visual shows New York City being engulfed by water. The video montage includes another unidentified person predicting that "flames cover hundreds of miles."
Then-GMA co-anchor Chris Cuomo appeared frightened by this future world. He wondered, "I think we're familiar with some of these issues, but, boy, 2015? That's seven years from now. Could it really be that bad?"
Ultimately, ABC delayed the air-date for Earth 2100 and the one-hour show didn't debut until June 2, 2009. The program showcased the terrible impact of global warming from 2015 through 2100. In the special, a "storm of the century" wiped out Miami. Other highlights included a destroyed New York City and an abandoned Las Vegas. By 2084, Earth's population will apparently be just 2.7 billion.
On June 13, 2008, ABCNews.com promoted the special by hyperventilating, "Are we living in the last century of our civilization?" Unlike the 2015 predictions, that suggestion hasn't (yet) been proven wrong.
Seven years later, the network has quietly ignored its horribly inaccurate predictions about 2015. When it comes to global warming claims, apparently results don't matter for ABC.
A partial transcript of the June 12, 2008 GMA segment is below:


GMA
6/12/08
8:34am
CHRIS CUOMO: Now, we will have a dramatic preview for you of an unprecedented ABC News event called "Earth 2100." We're asking you to help create a story that is yet to unfold: What our world will look like in 100 years if we don't save our troubled planet. Your reports will actually help form the backbone of a two-hour special airing this fall. ABC's Bob Woodruff will be the host. He joins us now. Pleasure, Bob.
BOB WOODRUFF: You too, Chris. You know, this show is a countdown through the next century and shows what scientists say might very well happen if we do not change our current path. As part of the show, today, we are launching an interactive web game which puts participants in the future and asks them to report back about what it is like to live in this future world. The first stop is the year 2015.
[NOTE: ABC provides no graphics or identification for any of the following individuals/activists featured. Identifications taken discerned from web article.]
UNIDENTIFIED MALE #1: The public is sleepwalking into the future. You know, sort of going through the motions of daily life and really not paying attention.
JAMES HANSEN (NASA/AL GORE SCIENCE ADVISOR): We can see what the prospects are and we can see that we could solve the problem but we're not doing it.
[Graphic: Welcome to 2015]
PETER GLEICK (SCIENTIST/PACIFIC INSTITUTE): In 2015, we've still failed to address the climate problem.
JOHN HOLDREN (PROFESSOR/HARVARD UNIVERSITY): We're going to see more floods, more droughts, more wildfires.
UNIDENTIFIED "REPORTER:" Flames cover hundreds of square miles.
UNIDENTIFIED VOICE: We expect more intense hurricanes.
UNIDENTIFIED MALE #5: Well, how warm is it going to get? How much will sea level rise? We don't know really know where the end is.
UNIDENTIFIED VOICE #2: Temperatures have hit dangerous levels.
UNIDENTIFIED VOICE #3: Agriculture production is dropping because temperatures are
rising.
HEIDI CULLEN (WEATHER CHANNEL/CLIMATE CHANGE EXPERT): There's about one billion people who are malnourished. That number just continually grows.
...
CUOMO: I think we're familiar with some of these issues, but, boy, 2015? That's seven years from now. Could it really be that bad?
WOODRUFF: It's very soon, you know. But all you have to do is look at the world today right today. You know, you've got gas prices going up. You got food prices going up. You've got extreme weather. The scientists have studied this for decades. They say if you connect the dots, you can actually see that we're approaching maybe even a perfect storm. Or you have got shrinking resources, population growth. Climate change. So, the idea now is to look at it, wake up about it and then try to do something to fix it.
...
WOODRUFF: But the best of these regular reports that come from people that are watching, we're going to put those on, all of this on our two-hour production that's going to happen in the fall. And we just want more of these people to watch. And we've gotten already some remarkable interviews from these people. And just take a quick look.
UNIDENTIFIED TEENAGER: It's June 8th, 2015. One carton of milk is $12.99.
SECOND UNIDENTIFIED MALE: Gas reached over $9 a gallon.
THIRD UNIDENTIFIED MALE: I'm scared [bleeped] right now, but I have to get this out.
WOODRUFF: So the producers actually work with those people that send in their ideas into the website. And then we're just hoping that the goal is ultimately get these ideas very soon.
CUOMO: Lovely. Bob Woodruff. Thank you very much. You can find out much more about how you can be part of this exciting and important show. You can go to Earth2100.tv. Earth2100.tv or you can go to ABCNews.com


- See more at: FLASHBACK: ABC's ’08 Prediction: NYC Under Water from Climate Change By June 2015
 
Last edited:

Omni

Banned
Aug 12, 2015
539
7
0
#30
Your idiot-shake brings all the idiots to the yard.
 
M

Mitspa

Guest
#31
That's what happens when you expose a liberal lie....
 
Apr 8, 2015
895
18
0
#32
Can I remind you all that this is a teen thread. I am disappointed this thread shifted to a stage for an adult argument. We teens are not political and believing in a flaw in climate science will not make us an uneducated conservative and nor does agreeing with the IPCCs assessment make us thoughtless radical leftist liberals. I'm a teen worried about my future and my children's.

Now - I am actually going to take the time to read through properly the references laid down. Keep in mind we teens read your to and fro arguments .
 
Last edited:
S

shotgunner

Guest
#33
Follow the money and the power. Look at who promoting global warming has benefited. It has put grant money into the hands of regulatory bodies and given unprecedented power to regulatory agencies to control lives and property.
 
Apr 8, 2015
895
18
0
#34
Heya my teen friends.

I've had heaps of assignments so havent had time to read the resources cited by Mitspa and PennEd. If I can say anything about having an idea on things, its to check the advice your giving and try to go back to the source.... The other thing I like to do is if I have an opinion, I try to find resources that prove I am wrong.... just saying stuff that u think is right just opens you to justified criticism unless you can back it up.

So Mitspa and PennEd were good enough to provide their views and resources to back it up...
@ PennEd... Your main citation was from the Telegraph Newspaper by a journalist Christopher Booker. Although he isnt a scientist hes a very entertaining journalist and I enjoyed reading him - but whats his credibility.... His Bio says that he is a right wing christian conservative who has campaigned against the "public health scaremongering" of asbestosis, passive smoking and 'mad cow disease (BSE)'..... in otherwords he thinks those diseases are over-stated. His is a campaigner against climate change science and his chief source was from a scientistist who argued that the temperature recordings in Sth Am were adjusted - Is it true ??? you have to judge yourself.... but as you can see his bio is a little scatchy when it comes to credibility on health issues.... That doesnt mean his position isnt true - but credibility/bias is an issue

Mitspa refers to two resources - One was Coleman who established the weather channel. Coleman was the founder of the weather channel and was forced out of the role after one year. He has no meterological academic qualifications, nor any in science and has produced no research. He is by profession a journalist. He is a very active anti-climate change activist.

Mitspa also mentions The Heartland Institute which is dedicated to campaigning against climate change policies and has its largest donor as David Koche who is a billionaire owner of a petrochemical company.

So am I saying Mitspa and PennEd are wrong - no what I am saying is the sources cited are not reliable. HOWEVER I found an excellent dosier produced by 60 well known and credible climate scientists who tabled thier counter arguments at the 2010 UN Climate summit. Their concerns were both well described and reasonable.

OK so heres my summary [remember dont listen or accept a single word I say - gather your own evidence and thoughts]

CO2 levels are climbing with increasing acceleration over the past 100 years - no matter which scientist you talk to this is accepted fact.

Mean Ocean Temperatures have risen over the past 20 years - Again this fact isnt disputed

Geographical iceforms have retreated - this isnt disputed either.. sateliites prove the point

The main arguments from opponents are steepest about implications - CO2 is rising but is it due to humans?
and so what if it rises?
and even if it does cause a temperature rise the argument is over the scientific projections over how fast and by how much it will rise
and last what will that rise mean for our climate and ecology.

I have read lots on this - particularly of late from counter arguments and my own view is that the body of scientific research far outweights in terms of logical and balanced research in favour of

CO2 is rising and accelerating and its casued by humans.
It will cause a mean ocean and mean land mass temperature rise that will result increasingly severe weather patterns that are potentially irreversible.


Ok thats enough for me - I cant vote but I want action. If youre like me and cant vote then as far as I am concerned our future is being held up for debate - My future and my childrens is being made a political football and influenced by petrochemical companies. I want a clean atmosphere. I want my future ecology stable.

I intend to start a facebook for those under 18 - what do we need to do? FIGHT FIGHT FIGHT for our rights to a future
 
Last edited:
Aug 12, 2015
539
7
0
#35
Heya my teen friends.

I've had heaps of assignments so havent had time to read the resources cited by Mitspa and PennEd. If I can say anything about having an idea on things, its to check the advice your giving and try to go back to the source.... The other thing I like to do is if I have an opinion, I try to find resources that prove I am wrong.... just saying stuff that u think is right just opens you to justified criticism unless you can back it up.

So Mitspa and PennEd were good enough to provide their views and resources to back it up...
@ PennEd... Your main citation was from the Telegraph Newspaper by a journalist Christopher Booker. Although he isnt a scientist hes a very entertaining journalist and I enjoyed reading him - but whats his credibility.... His Bio says that he is a right wing christian conservative who has campaigned against the "public health scaremongering" of asbestosis, passive smoking and 'mad cow disease (BSE)'..... in otherwords he thinks those diseases are over-stated. His is a campaigner against climate change science and his chief source was from a scientistist who argued that the temperature recordings in Sth Am were adjusted - Is it true ??? you have to judge yourself.... but as you can see his bio is a little scatchy when it comes to credibility on health issues.... That doesnt mean his position isnt true - but credibility/bias is an issue

Mitspa refers to two resources - One was Coleman who established the weather channel. Coleman was the founder of the weather channel and was forced out of the role after one year. He has no meterological academic qualifications, nor any in science and has produced no research. He is by profession a journalist. He is a very active anti-climate change activist.

Mitspa also mentions The Heartland Institute which is dedicated to campaigning against climate change policies and has its largest donor as David Koche who is a billionaire owner of a petrochemical company.

So am I saying Mitspa and PennEd are wrong - no what I am saying is the sources cited are not reliable. HOWEVER I found an excellent dosier produced by 60 well known and credible climate scientists who tabled thier counter arguments at the 2010 UN Climate summit. Their concerns were both well described and reasonable.

OK so heres my summary [remember dont listen or accept a single word I say - gather your own evidence and thoughts]

CO2 levels are climbing with increasing acceleration over the past 100 years - no matter which scientist you talk to this is accepted fact.

Mean Ocean Temperatures have risen over the past 20 years - Again this fact isnt disputed

Geographical iceforms have retreated - this isnt disputed either.. sateliites prove the point

The main arguments from opponents are steepest about implications - CO2 is rising but is it due to humans?
and so what if it rises?
and even if it does cause a temperature rise the argument is over the scientific projections over how fast and by how much it will rise
and last what will that rise mean for our climate and ecology.

I have read lots on this - particularly of late from counter arguments and my own view is that the body of scientific research far outweights in terms of logical and balanced research in favour of

CO2 is rising and accelerating and its casued by humans.
It will cause a mean ocean and mean land mass temperature rise that will result increasingly severe weather patterns that are potentially irreversible.


Ok thats enough for me - I cant vote but I want action. If youre like me and cant vote then as far as I am concerned our future is being held up for debate - My future and my childrens is being made a political football and influenced by petrochemical companies. I want a clean atmosphere. I want my future ecology stable.

I intend to start a facebook for those under 18 - what do we need to do? FIGHT FIGHT FIGHT for our rights to a future
A well formed, sensible conclusion, drawn from a balanced weighting of all evidence, making sure that sources are scrutinized for bias and that material is analyzed with a sufficient understanding of the base science. Thank goodness you're part of the next generation.
 
Dec 1, 2014
1,430
27
0
#36
There are so many serious issues we all face but to me Global Warming is the greatest threat of all. It isnt concerned with borders or politics and it effects everyone.

Uh....so sorry to burst your bubble...but the greatest, most serious issue anyone faces is the fact that heaven and hell is real. Do you want smoke free accomodations, or would you require and seek a smoking section? The choice is YOURS...and, when that choice is made, then the rest of your earthly life should be totally focused on that choice. If heaven is your plan, then you need to meet the Carpenter who tells us "I go to prepare a place for you, and if I go to prepare a place for you, I will return for you!" If hell is your choice, then please continue to get involved with anything but what the Carpenter would construct.
Christians need to be committed to CHRIST, sharing HIM, having a relationship with HIM, helping Him build His kingdom..need I say more?
 
M

Mitspa

Guest
#37
I don't see any reason to believe its real...
 
Apr 8, 2015
895
18
0
#38
PWRNJC - The discussion was purely secular. You'll see when you read through the threads its a discussion based on scientific understanding - the discussion is balanced with both sides raising good points. This wasnt a spiritual discussion.
 
Y

YellowDucky

Guest
#39
Hiya peeps. So im reading all of this and its weird that i found global warming as a discussion topic 030 if its not so much to say, global warming, deforestation, GMOs are not as important as sharing the gospel. Not to be ignorant but we are called to spread the good news not worry about the bad news. Some things are temporal and others eternal. Anyways, i hope have an awesome day. Peace ^~^/
 
M

Mitspa

Guest
#40
I would say this ..the "spirit" behind many things, is indeed a spirit that deceives many into left wing ideas that have agendas that the bible warns us against. The concept of worship of the creation over the Creator can be seen very clearly in much of this left wing propaganda.