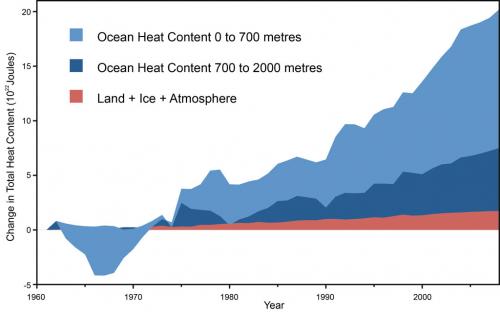
Sorry, zippy, as was explained to you SEVERAL times, that first graph is a graph of the change in ocean heat content, not global temperatures.
(you see, you know this because because it says so right on the graph - am I going to fast?)
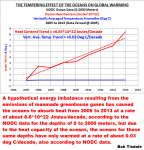
And, as I've already shown, ALL of that change in ocean heat content comes out to .03 deg/decade change in global temperatures.
Oh, and as for the 'this scientist doesn't believe my global warming lies and so I'll say he's discredited', if you'd have taken the time to look, Tisdale's graph is based on data from the National Oceanographic Data Center, so I assume they're 'discredited' as well.
OH, and by the way, not one of those graphs is an 18 year graph. I guess I it's my fault, I should have explained it to you like I was talking to a 4 year old:
You see, you have to show an 18 year graph that only has 18 years of data on it in order to show a trend line for the last 18 years. I'm pretty sure you don't know what a trend line is, but I won't explain it now because I'm pretty sure your head is starting to hurt. But it looks like this:
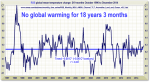
See how simple that was.
This proves that:
1. There has been no statistical global warming for 18 years
2. You are wrong about everything
And anything else you post will just prove that
1. You are not interested in facts, and you are unable to learn anything that conflicts with your PROVEN FALSE global warming religion.