We have been lied to about Global Warming, but WHY?

  • Christian Chat is a moderated online Christian community allowing Christians around the world to fellowship with each other in real time chat via webcam, voice, and text, with the Christian Chat app. You can also start or participate in a Bible-based discussion here in the Christian Chat Forums, where members can also share with each other their own videos, pictures, or favorite Christian music.

    If you are a Christian and need encouragement and fellowship, we're here for you! If you are not a Christian but interested in knowing more about Jesus our Lord, you're also welcome! Want to know what the Bible says, and how you can apply it to your life? Join us!

    To make new Christian friends now around the world, click here to join Christian Chat.
You know those big blocks of ice on the North End of the planet that have decreased by more than half their size in about fity years or so? Those big blocks of ice melt more each year, causing colder, fresh, water to seep into salty oceans, resulting in disruption of important pressure systems and sea currents, resulting in colder weather in many parts of the world, as well as verifiably higher sea levels around the globe (because of course, more liquid water in the oceans means more sea!)You should learn the difference between climate and weather.

Uh, you do know that the vast majority of land ice is the Antarctic, right? And that the vast majority of ice in the Arctic is sea ice, right? And you do realize that melting sea ice wouldn't cause rising oceans, right? (Well, I guess you know these things NOW).
You should learn the difference between The Arctic Region and Antarctica.

Plus, NONE of these things will happen unless there is global warming, and thus:

It IS global warming, when we talk about it in terms of average global temperature

Once again, there has been NO STATISTICAL TEMPERATURE INCREASE FOR 18 YEARS!!!
I've asked REPEATEDLY for you to show me evidence of it, and even though you can't and you KNOW you're wrong, you continue to sprout this UNSCIENTIFIC nonsense.

Please show me an 18 year graph that shows exponential (your word) global warming. (the polar ice caps will probably melt before you can produce that, I assure you).
 
Went and saw the Kingsman last night. Interesting that they portrayed the global warming guy as a lunatic.
 
Uh, you do know that the vast majority of land ice is the Antarctic, right? And that the vast majority of ice in the Arctic is sea ice, right? And you do realize that melting sea ice wouldn't cause rising oceans, right? (Well, I guess you know these things NOW).
You should learn the difference between The Arctic Region and Antarctica.

This is just idiocy.

Plus, NONE of these things will happen unless there is global warming, and thus:


Once again, there has been NO STATISTICAL TEMPERATURE INCREASE FOR 18 YEARS!!!
I've asked REPEATEDLY for you to show me evidence of it, and even though you can't and you KNOW you're wrong, you continue to sprout this UNSCIENTIFIC nonsense.

Please show me an 18 year graph that shows exponential (your word) global warming. (the polar ice caps will probably melt before you can produce that, I assure you).

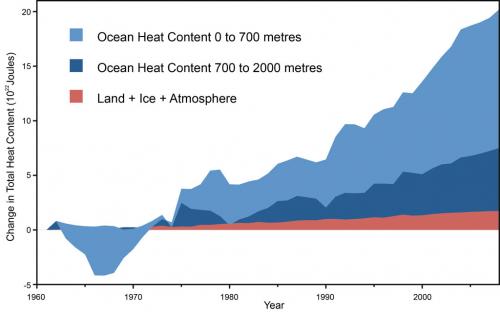
You're obviously too mathematically under informed to understand that an increase heat content is the same thing as an increase in heat. If the land, ice and atmosphere has lost 1 ^22 joules of heat content in the last 18 years, and the sea has GAINED at a reserved estimate 8^22 joules of heat in the last 18 years, then that is a global increase in heat content of 7^22 joules across the entire globe in the last 18 years.

That equates to a total average heat increase of about 0.22 degrees celcius in the last 18 years. To put that number of joules in perspective, there are 4.1 megajoules in a Hiroshima atomic bomb. There has been a heat increase of 7^22 joules across the globe since 1988. 7^22/4.1 mj is 10^11.

Or in plain speech, since 1998 the heat energy increase of the Earth is the equivalent of more than 100,000,000,000 Hiroshimas.


Nuccitelli_OHC_Data_med.jpg
 
Last edited:


I'm too tired of your crap to write anything new, I'll just repost my response from when you tried your failed ocean heat content gambit last week. Maybe you'll reply this time instead of running and hiding and hoping no one will remember:

THAT GRAPH SHOWS THAT EARTH HAS GOTTEN CONTINUALLY WARMER FOR THE LAST 40 YEARS AND ALARMINGLY WARMER FOR THE LAST 15
No it doesn't, it shows ocean heat content has increased. You're confusing your graphs again.

Again, these are SURFACE AIR TEMPERATURE graphs.
Interesting that you should mention that the surface air temperature graphs don't tell the whole story, when it was YOU who used the VERY SAME GRAPH as proof of global warming a few hours ago. It's from YOUR graph.

Of course that can only mean that your brand new to using the old 'oceans are taking the heat' trick. But since you're brand new to this and googling like mad, you don't realize your error. Allow me to once again educate you

"Now, I've shown there is a definite increase in global average temperature"
Nope, what you've done is once again shown is that you can take any graph that shows an increase, and then claim it's global warming (hey, you're Michael Mann). If you'll look carefully at your graph, it's shows the change in total heat content (I'll try to go slow, I know you're new to this - but once again, you can't just pick any old graph off the internet and claim it stands for global warming).

But the question isn't "what's the change in total heat content of the oceans", the proper question is "what does an increase of approximately 8.6 times 10 to the 22nd power joules mean for global average temperatures? Please answer that question.

Oh wait, who am I kidding, you have no idea. That's ok, neither did I. Here's a link that explains it for both of us:

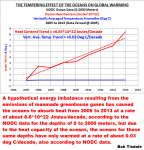
The Tempering Effect of the Oceans on Global Warming | Watts Up With That?

If you don't wish to read it, in layman's terms it basically says that the oceans are so massive that the final tally for all this increase in ocean heat content is, wait for it----> .03 deg cent/decade. That's POINT OH THREE

So, now that your multi-multi-post ocean gambit has failed, I'll go back to my original request:

Please show an 18 year graph that shows this massive warming you're talking about. (EIGHT-TEEN)

Since you obviously didn't read this last time and are repeating your mistakes, here you go. Oh, and by the way,


I'M STILL WAITING FOR THAT 18 YEAR GRAPH THAT SHOWS EXPONENTIAL WARMING!!!!!!!!!!!!!


figure-2-tempering-effect-of-ocean-on-global-warming.png
 
And this is just so important that it has to be discussed in a CHRISTIAN chatroom forum? TO what purpose? Why so? WHO is benefitting here, certainly not JESUS. I would post it in a political chatroom where unasked opinions are accepted. lol
 
And this is just so important that it has to be discussed in a CHRISTIAN chatroom forum? TO what purpose? Why so? WHO is benefitting here, certainly not JESUS. I would post it in a political chatroom where unasked opinions are accepted. lol
Are you not aware of the title of this forum section, "Conspiracy and Corruption Forum"? If not, you might want to look at the forum description on the menu page: "Forum for Christian discernment of government/political/corporate/academic conspiracy, agendas, corruption, greed, etc., and the very real spiritual conspiracy behind it all."

 
It's important that the more and more people get the truth about the climate change hoax that is affecting us all. The evidence is clear now that a relatively few people have foisted thuis hoax on us. But why? I would submit the reason is their desire to push socialism, wealth transfer, and power consolidation. Here is the article proving that these people will gladly lie to try and achieve their goal:

The fiddling with temperature data is the biggest science scandal ever - Telegraph
To find out WHY we should first look at WHO is on the bandwagon & investigate what elite groups they belong to. You will find that the vast majority belong to one or more of the groups like these. This triangle is only a representation of world domination by the elite:

666vatican-down-power-pyramid_thumb.jpg


You'll find in your own investigation that it's more conspiracy FACT than theory.
 
Remember all the nonsense about the "o-zone" ...why have we not heard much about that lately? Because its was all untrue!

so they go to something else to try to control people with!

Other scientific papers have confirmed that the ozone depletion theory is wrong. The Norwegian science magazine From the World of Physics, for example, published a thorough review of ozone science by Thormod Henriksen from the Institute of Physics at the University of Oslo, which presents evidence that the ozone layer was thinner in the 1940s than today!
 
Remember all the nonsense about the "o-zone" ...why have we not heard much about that lately? Because its was all untrue!

so they go to something else to try to control people with!

Other scientific papers have confirmed that the ozone depletion theory is wrong. The Norwegian science magazine From the World of Physics, for example, published a thorough review of ozone science by Thormod Henriksen from the Institute of Physics at the University of Oslo, which presents evidence that the ozone layer was thinner in the 1940s than today!

Hmm. Well here's a paper from the same Thormod Henriksen, Arne Dahlback, Søren H.H. Larsen and Johan Moan that says otherwise.

ULTRAVIOLET-RADIATION and SKIN CANCER. EFFECT OF AN OZONE LAYER DEPLETION - Henriksen - 2008 - Photochemistry and Photobiology - Wiley Online Library
 
Woohoo ten points for the sermonizing! Yay!
THAT'S not sermonizing, THIS is sermonizing:


  • The point is, the temperature rise we see is an exponential increase
  • It's an accumulative problem, with an exponential increase, and that increase will get faster
  • the temperature is on an exponential upward increase
  • the temperature increase is outside natural variance and the temperature increase has substantive consequences for the Earth's climate
  • 1. We are seeing rises in temperature
  • 2. The increase is exponential
  • 3. It's continuing to happen.
  • The heat content of Earth is quantitatively greater than it was 18 years ago. That's called global warming

  • MEAN GLOBAL TEMPERATURE ACROSS ALL FRONTS (not just mean surface air temperature) stands outside natural variance and as CO2 increases, global mean temperature increases
  • EARTH HAS GOTTEN CONTINUALLY WARMER FOR THE LAST 40 YEARS AND ALARMINGLY WARMER FOR THE LAST 15

***All the above quotes taken from 'Human' on this thread.

Now, THAT my friend, is some sermonizing. In summation, you have CONTINUALLY claimed that the earth is warming, continuing to warm, and currently warming at an unprecedented, alarming, and exponential rate.

However, I have CONSTANTLY asked you to show just ONE graph of the last 18 years and you have failed to produce any. You continue to choose to believe despite having no evidence for your beliefs.

Why again should we believe anything you say related to 'science'?
 

THAT'S not sermonizing, THIS is sermonizing:


  • The point is, the temperature rise we see is an exponential increase
  • It's an accumulative problem, with an exponential increase, and that increase will get faster
  • the temperature is on an exponential upward increase
  • the temperature increase is outside natural variance and the temperature increase has substantive consequences for the Earth's climate
  • 1. We are seeing rises in temperature
  • 2. The increase is exponential
  • 3. It's continuing to happen.
  • The heat content of Earth is quantitatively greater than it was 18 years ago. That's called global warming

  • MEAN GLOBAL TEMPERATURE ACROSS ALL FRONTS (not just mean surface air temperature) stands outside natural variance and as CO2 increases, global mean temperature increases
  • EARTH HAS GOTTEN CONTINUALLY WARMER FOR THE LAST 40 YEARS AND ALARMINGLY WARMER FOR THE LAST 15

***All the above quotes taken from 'Human' on this thread.

Now, THAT my friend, is some sermonizing. In summation, you have CONTINUALLY claimed that the earth is warming, continuing to warm, and currently warming at an unprecedented, alarming, and exponential rate.

However, I have CONSTANTLY asked you to show just ONE graph of the last 18 years and you have failed to produce any. You continue to choose to believe despite having no evidence for your beliefs.

Why again should we believe anything you say related to 'science'?


Bod Tisdale, is a discredited scientist. Most of these graphs hit the year 2000, the newest ones you can download in PDF from this website, the PICC 5th assessment report of 2014.

Fifth Assessment Report - Climate Change 2013


Nuccitelli_OHC_Data_med.jpg

fig2-7s.gif


fig2-8s.gif

fig2-6s.gif


fig2-11s.gif


fig2-12s.gif

fig2-14s.gif

fig2-15s.gif


fig2-13s.gif

fig2-1s.gif


fig2-18s.gif


fig2-1s.gif

fig2-4s.gif
 
Last edited:
Sorry, zippy, as was explained to you SEVERAL times, that first graph is a graph of the change in ocean heat content, not global temperatures.

(you see, you know this because because it says so right on the graph - am I going to fast?)

And, as I've already shown, ALL of that change in ocean heat content comes out to .03 deg/decade change in global temperatures.

Oh, and as for the 'this scientist doesn't believe my global warming lies and so I'll say he's discredited', if you'd have taken the time to look, Tisdale's graph is based on data from the National Oceanographic Data Center, so I assume they're 'discredited' as well.

OH, and by the way, not one of those graphs is an 18 year graph. I guess I it's my fault, I should have explained it to you like I was talking to a 4 year old:

You see, you have to show an 18 year graph that only has 18 years of data on it in order to show a trend line for the last 18 years. I'm pretty sure you don't know what a trend line is, but I won't explain it now because I'm pretty sure your head is starting to hurt. But it looks like this:
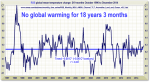
gw.png


See how simple that was.

This proves that:
1. There has been no statistical global warming for 18 years
2. You are wrong about everything

And anything else you post will just prove that
1. You are not interested in facts, and you are unable to learn anything that conflicts with your PROVEN FALSE global warming religion.

 
Heat content is a thermodynamic quantity equal to the internal energy of a system plus the product of its volume and pressure; the measurement thereof allowing us to see its enthalpy, or the amount of energy in a system capable of doing mechanical work. We work from heat content in joules because different areas of Earth have different pressure systems, dum dum.

Temperature is the degree of heat present in a substance or object as expressed according to a comparative scale such as a thermometer, and we use this method to calculate in simple units the degree of heat content in a specific locale, dum dum.

Temperature is a deductive measure of the average heat or thermal energy of the particles in a substance. HEat content is also a measure of its energetic potential.

The term ''temperature anomaly'' means a departure from a reference value for temperature, which of course, is the temperature from last year, or last month, or whatever specific point you use as reference. Anomaly graphs are temperature graphs, they show temperature deviation from point to point. A positive anomaly indicates that the observed temperature was warmer than the reference value, while a negative anomaly indicates that the observed temperature was cooler than the reference value.

In all the cases above, both the global heat content and the temperature anomaly get larger from 1998 until now.

If you don't understand that this means a rise in global (not local, not surface air, not bloody the temperature of your room, but GLOBAL -- the seas, the air, the atmosphere) temperature, then you're an idiot, and that isn't my problem.